Monitoring instrument performance is important task in every mass-spectrometry lab. Each of the lab has its own set of QC samples/procedures, and most of them are supposed to answer one main question: is my system in a good shape and ready to run samples? However, Simple yes/no answer might not be enough if one really curios what went wrong and why. And most importantly - how to fix it and how to detect it earlier next time. In this post we’ll look at the data from two very similar LC-MS systems, one of which is definitely underperformed.
Q Exactives
The Thermo Scientific™ Q Exactive™ HF hybrid quadrupole-Orbitrap mass spectrometer was introduced in 2014, and featured several innovations over original Q Exative benchtop mass-spectrometers:
injection flatapole, preventing unwanted ions from entering deep into the system, and thereby increasing its robustness;
new segmented quadrupole, with higher fidelity of isolation efficiency over a wide range of isolation windows, provides an almost 2-fold improvement of transmission at narrow isolation widths;
a compact Orbitrap analyzer, leading to higher field strength and almost doubling the resolution at the same transient times.
Few years later, Thermo released new version in Q Exactive family - Q Exactive HF-X. New version included a new software algorithm designed for better peak isotope detection and a brighter ion source designed for enhanced sensitivity, together with measures to minimize ion-transfer times designed for faster HCD acquisition speeds.
The Q Exactive HF and Q Exactive HF-X are both high-resolution mass spectrometers, designed for high-performance proteomics and metabolomics research. While they share many similarities, there are key improvements in HF-X compared to HF:
Resolution and Scanning Speed: a new resolution setting with increased scanning speed: Up to 40 Hz for MS/MS, which is more than double that of the HF. This allows for faster data acquisition and higher throughput.
Sensitivity: better sensitivity compared to the HF, particularly for low-abundance peptides and ions. This is due to enhancements in the ion optics and detection system.
Ion Optics and Transmission: an improved ion optical system, including a higher capacity transfer tube and an advanced quadrupole design, which enhances ion transmission and reduces ion loss.
Fragmentation Efficiency: advanced higher-energy collisional dissociation (HCD) cell, which improves fragmentation efficiency and provides more informative MS/MS spectra.
At ###### ########## we’ve started with refurbished Q Exactive HF back in 2017, and expanded our MS capabilities by getting brand-new Q Exactive HF-X early in 2018. Now in 2025, our Q Exactives are still acting as work-horses in routine TMT-based relative protein quantification. So how are those instruments are doing now after all these years?
Before we are headed full-speed into the head-to-head comparison, lets take a look at specs to set out the scene.
| Characteristic | Q Exactive HF | Q Exactive HF-X |
|---|---|---|
| Analyzer | Ultra-High Field Orbitrap | Ultra-High Field Orbitrap |
| Mass range | 50–6,000 Th | 50–6,000 Th |
| Maximum Resolution at m/z 200 | 240,000 | 240,000 |
| Scan Speed (15 K) | 18-22 Hz (15K) | 28 Hz |
| Source | S-lens | electrodynamic ion funnel |
| Transient time (45K) | 96 ms | 96 ms |
On the paper, in application to the TMT, both instruments look quite similar, except for slightly lower scan overhead times on HF-X compared to HF. But what about real-life application?
Test samples and run parameters
Proteomics samples were prepared using human cell lines. Cell line and type of experiment are not of importance here, as we are only focusing on the instrument performance.
Curious mind may ask why not using well established standard samples to evaluate performance of the different MS systems. That is valid point. However, well-established QC samples not often reflects reality very well.
Proteins were reduced with TCEP, alkylated with CAA, and digested with Trypsin/LysC mixture in a presence of 0.1% Rapigest. Peptides were de-salted using Oasis HL-B cartridges (Waters), and fractionated by LC at high pH (XBridge BEH C18 186003615 column, mobile phase A: 0.05% NH3OH, phase B: 0.05% NH3OH 80% ACN).
Same set of samples (four individual fractions), were processed on the same LC-MS systems, with only difference in MS part - either Q Exactive HF, or Q Exactive HF-X. LC part consisted of Evosep One LC system (Evosep) and IonOptics column (Aurora Rapid 8×150 XT C18 UHPLC column).
As for the mass-specs, they were operated using very similar acquisition methods (find three differences):
| Parameter | Q Exactive HF | Q Exactive HF-X |
|---|---|---|
| Run time | 44 min | 44 min |
| MS1 resolution | 120,000 | 120,000 |
| MS1 AGC target | 3×10⁶ | 3×10⁶ |
| MS1 max IT | 50 ms | 50 ms |
| Scan range | 380 - 1650 Th | 380 - 1650 Th |
| MS2 resolution | 45,000 | 45,000 |
| MS2 AGC target | 1×10⁵ | 1×10⁵ |
| MS2 max IT | 96 ms | 96 ms |
| Loop count | 15 | 15 |
| Fixed first mass | 100 Th | 100 Th |
| Isolation window | 1.2 Th | 1.2 Th |
Comparison of the results
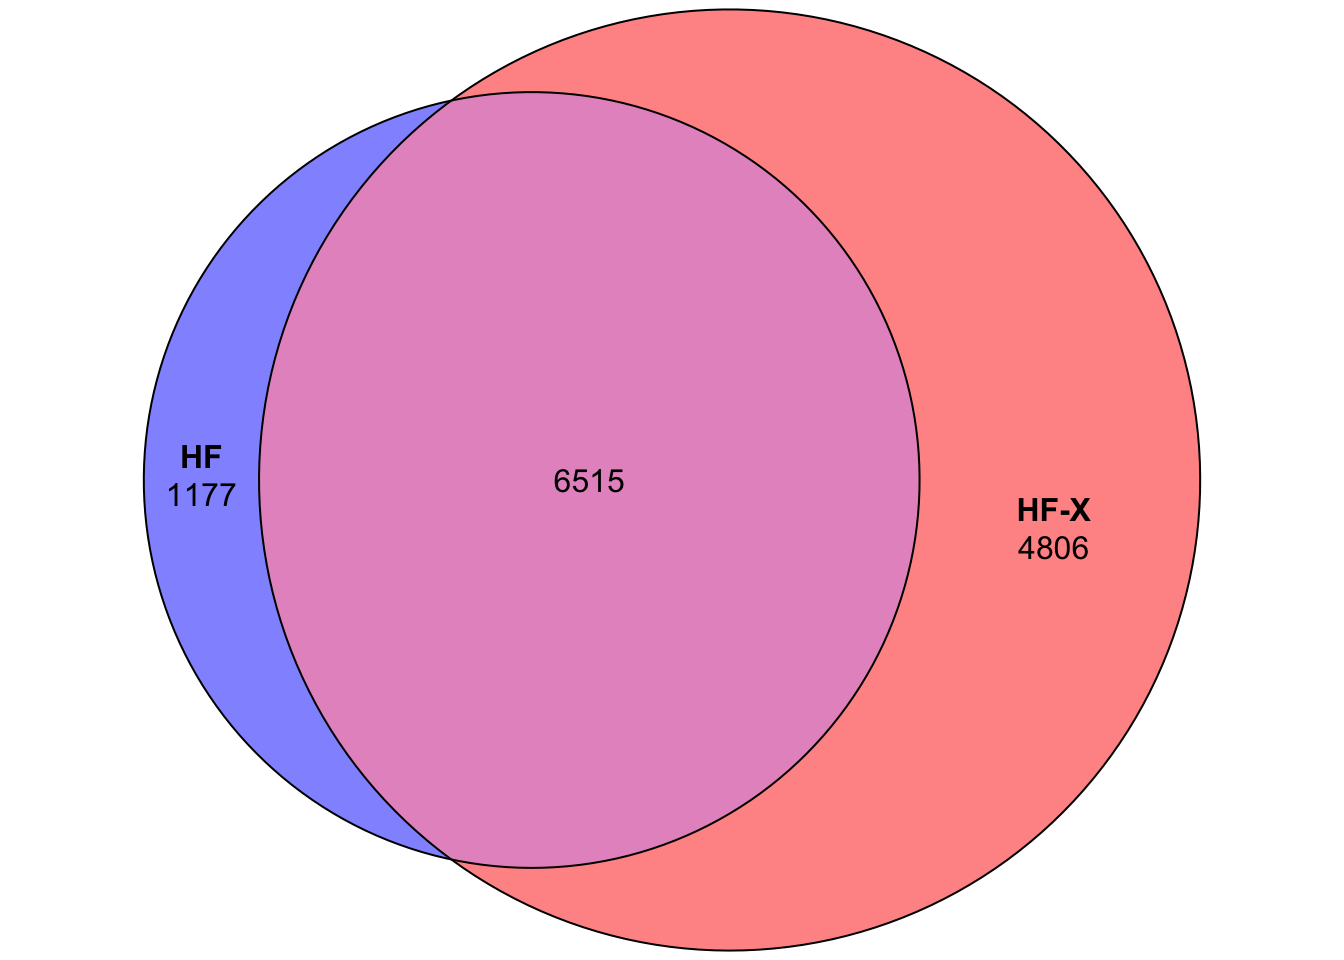
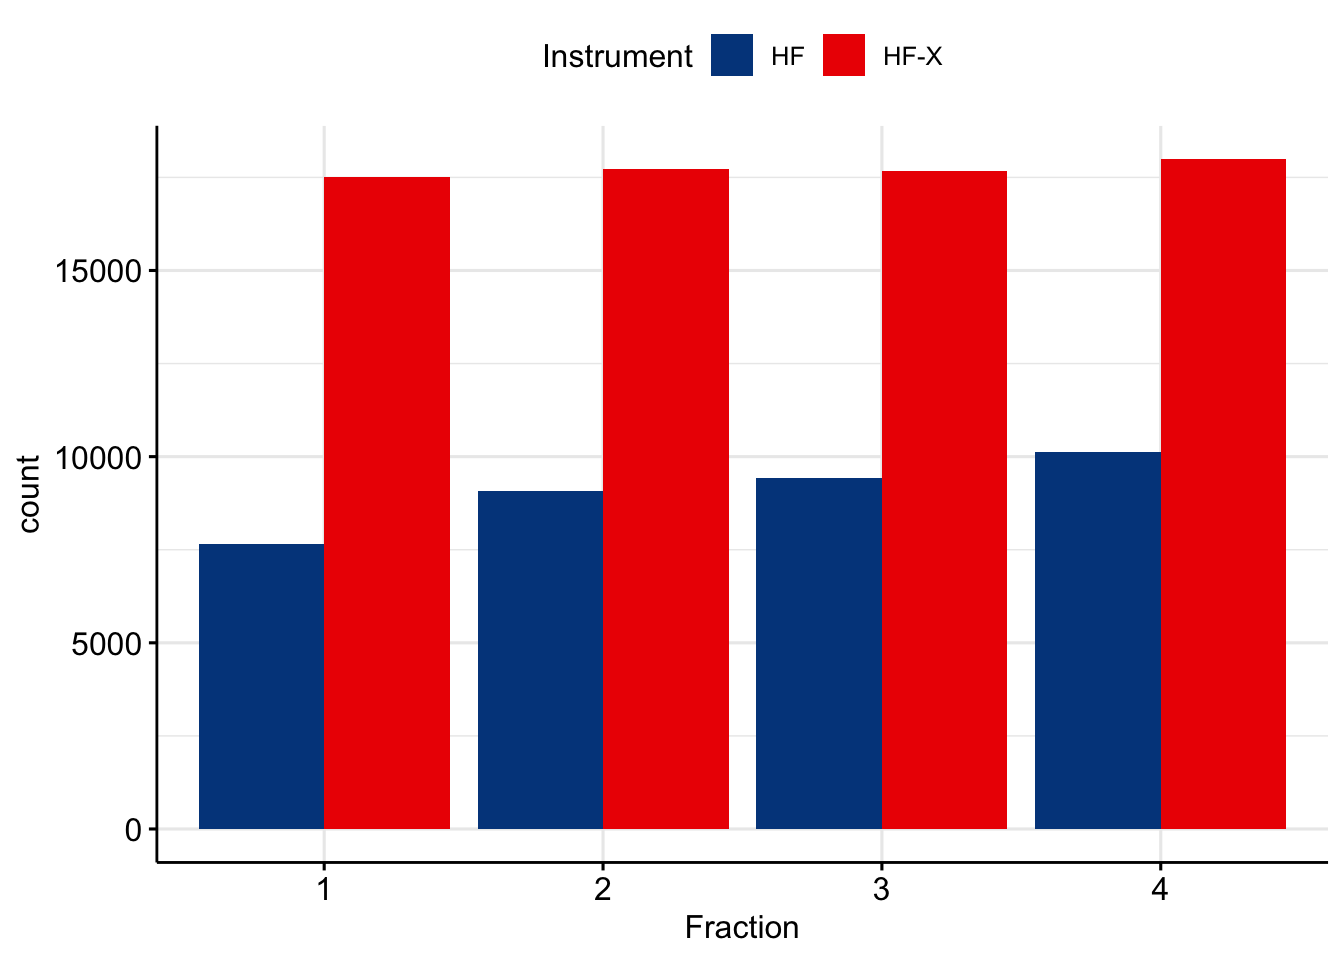
Ok, since its not a scientific paper, let’s cut the crap and look at what is happening. If you look at number of peptides identified, you get into deep depression. It does look like HF-X produces way more PSMs.
I was extremely surprised by these results. There shouldn’t be such a dramatic difference, given that we tend to load a lot of material on the column. Lets try to investigate what is going on here. First, let’s take a look at base peak chromatogram for fraction #4 on each instruments.
Base peak chromatograms
Nearly two orders of magnitude difference in BPC intensity. That doesn’t seem right at all. How about real acquisition speed?
To remind ourselves, transient time at the resolution of 45,000 is equal to 96ms.
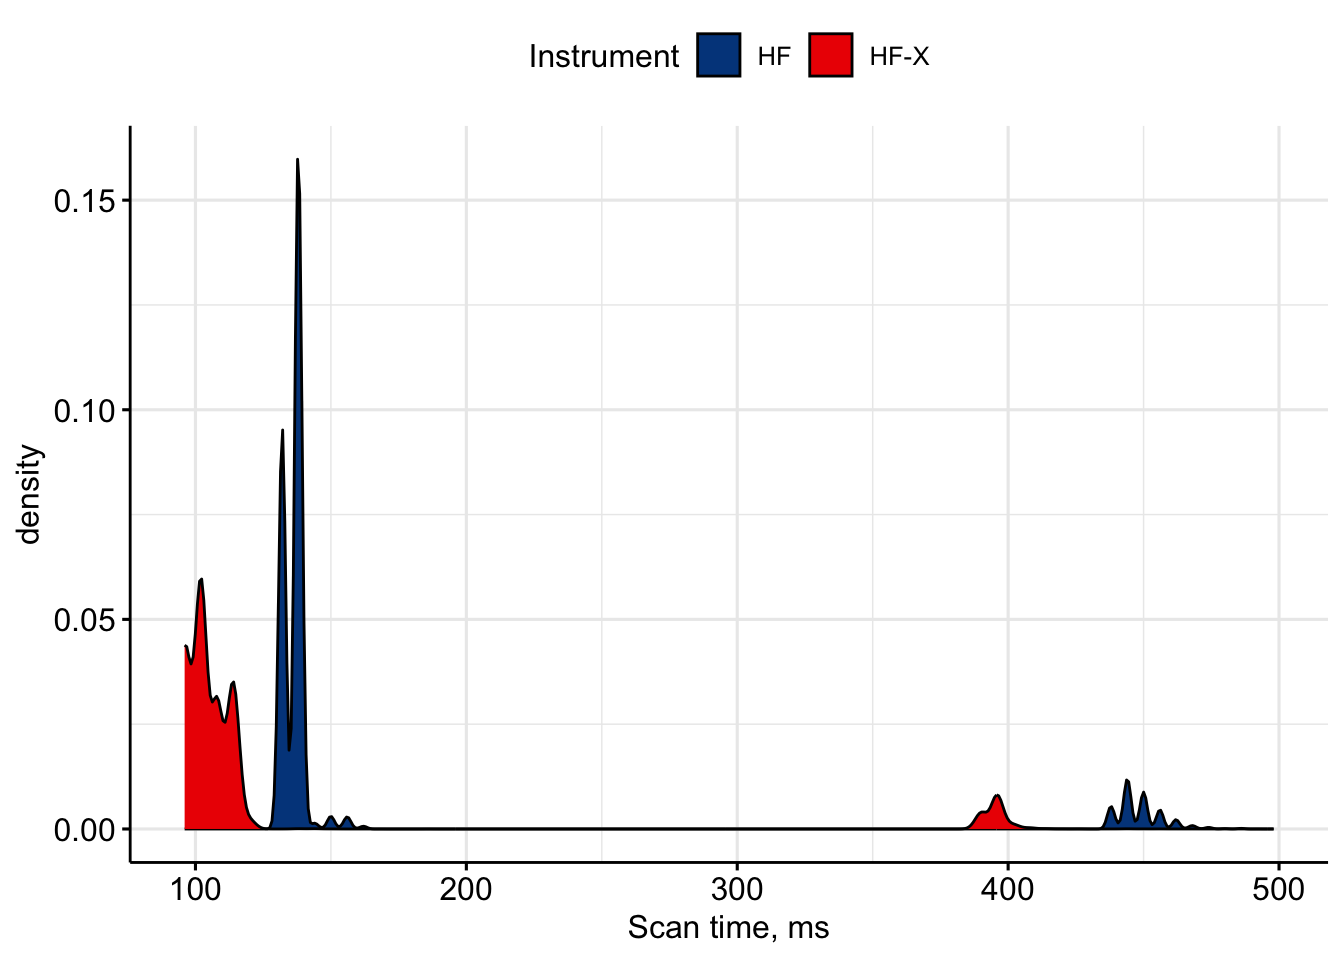
Scan speed
We can see expected difference in scan speed for two instruments - around 100ms per scan for HF and a it longer (~135 ms) for HF. However, somehow HF managed to get nearly two times less spectra compared to HF. This is insane!
Ok, intensity is low, number of IDs is low, less spectra than expected. Maybe it is dirty quad on HF? Let’s run Isolation Transmission Endurance Test and see:
![]()
No way, its 1.02, Carl!
Conclusion
Terrible performance of our Q Exactive HF, service ticket created.
Evaluation to be continued when Q Exactive HF is restored to normal state.